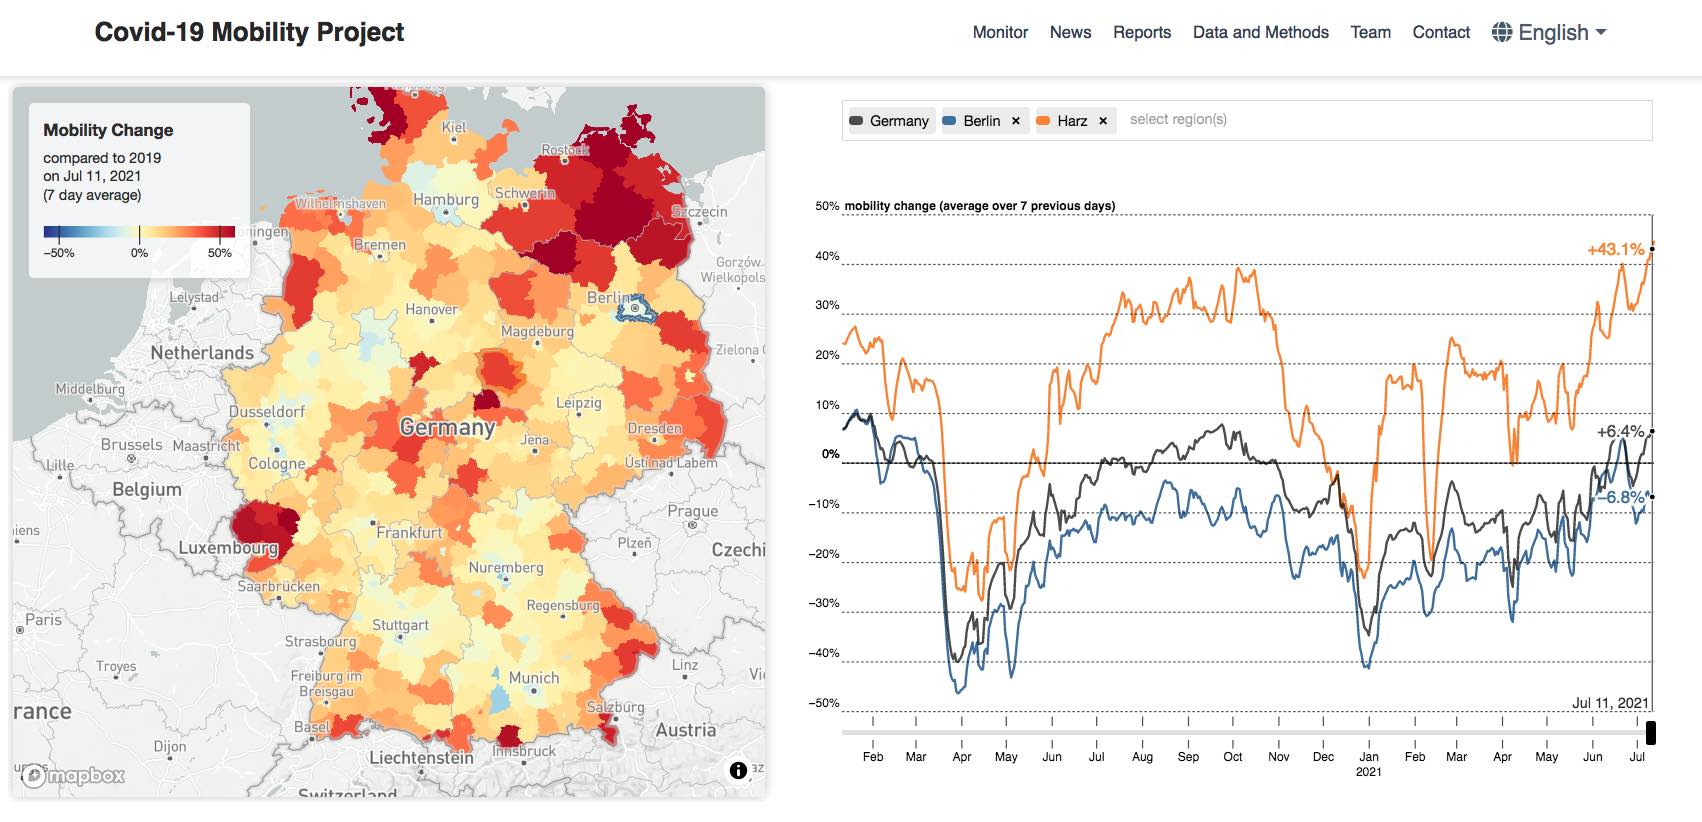
The website of the Covid-19 Mobility Project, giving a live picture of mobility in Germany during the pandemic.
In March 2020, it was clear that Covid-19 was heading down a bad path. At that time, I was busy working on my PhD on Human mobility and epidemic spreading – a topic that suddenly gained a lot more importance.
I was then working at the Complex Systems Lab, which is situated at the Humboldt University of Berlin and the Robert Koch-Institute, so I was among the researchers that were first trying to understand the new pandemic.
By March 2020, when the pandemic arrived in Germany, many of our current tools and methods were outdated and not applicable anymore. We’ve never been in such a situation before. It was clear that new approaches were necessary.
Mobility and the pandemic
Human mobility has always been a crucial ingredient to understand disease spread: Infections only spread when people meet, and people only meet when they move.
Early evidence from China suggested that mobility restrictions were one of the most effective tools for containing the pandemic. Lockdowns were soon used in countries all over the world. In mid-March 2020, Germany entered its first lockdown.
However, it wasn’t clear how effective the mobility restrictions were. Did people actually reduce their mobility? If so, by how much?
Answering these questions was important to understand whether the rules and regulations were appropriately measured, too soft or too strict, and whether they actually helped to curb the spread of COVID-19.
Mobility data
In March 2020, I got the great opportunity to work with anonymized mobility data for Germany extracted from mobile phones. The data contains the number of people that move between and within counties (Kreise) in Germany, on a daily basis.
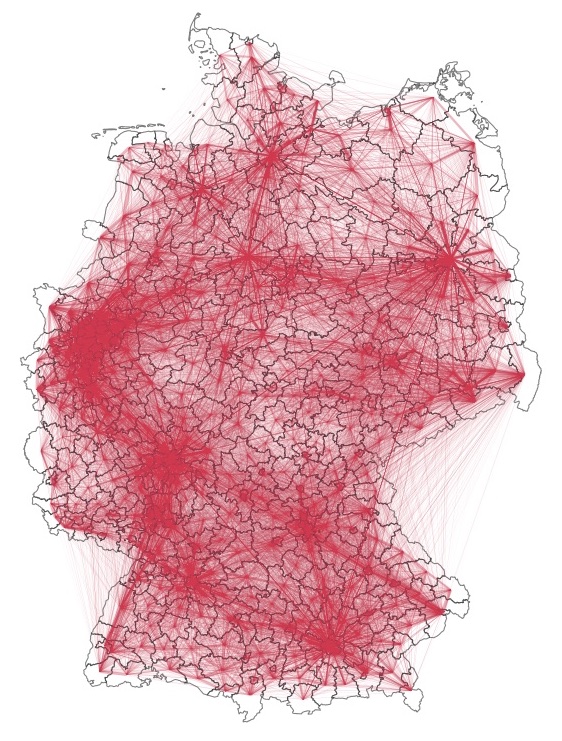
The mobility network for Germany. Lines represent trips between counties.
I quickly realized how useful this data was to understand the current situation. And so I started the Covid-19 mobility project, where I analyzed this wealth of data, first alone and then as the scientific lead for a group of researchers and Data Scientists.
Mobility reduction
What we found was astounding: During the lockdown in March 2020, we saw an immediate reduction in mobility in all of Germany. In the short course of three weeks, mobility was reduced by -40% compared to pre-pandemic levels.
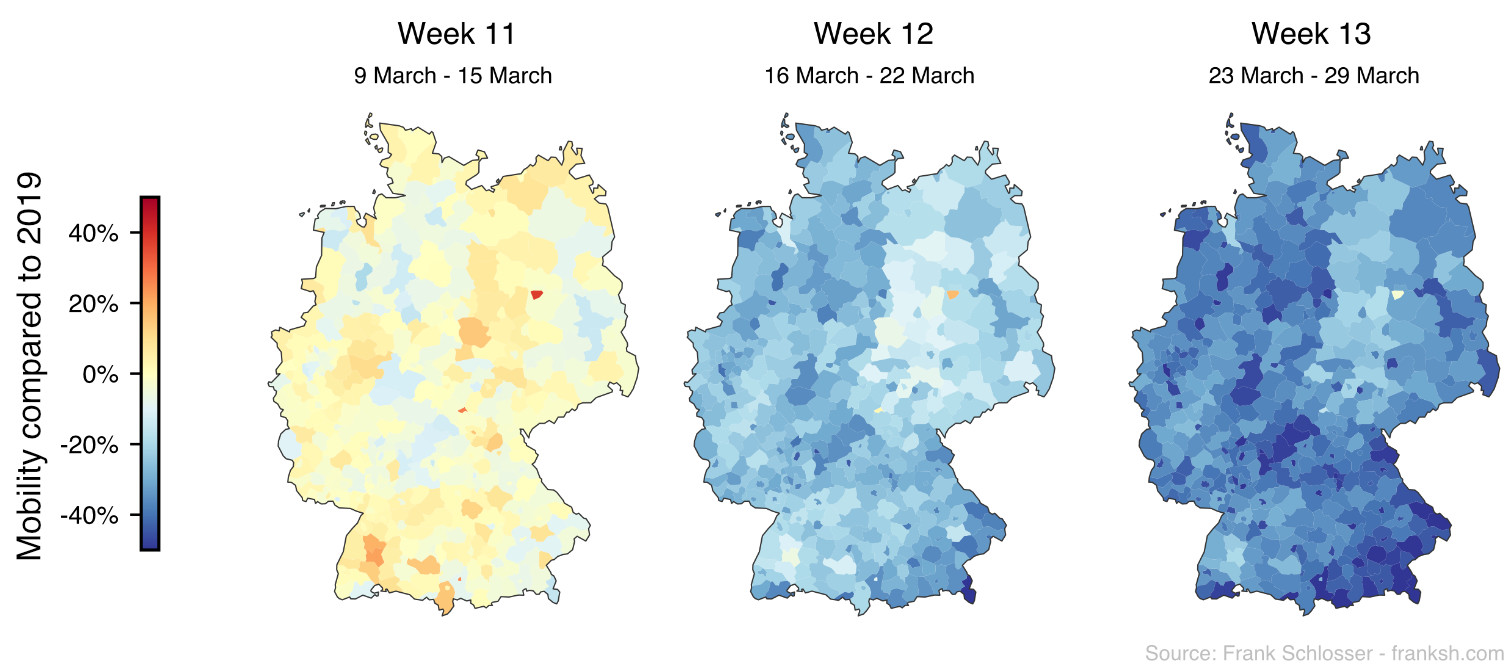
Mobility during March 2020 in Germany
We monitored mobility during the whole pandemic. The average mobility was never as low as during the first lockdown. During the “Lockdown light”, which started in November 2020, mobility was only reduced by around -10%.
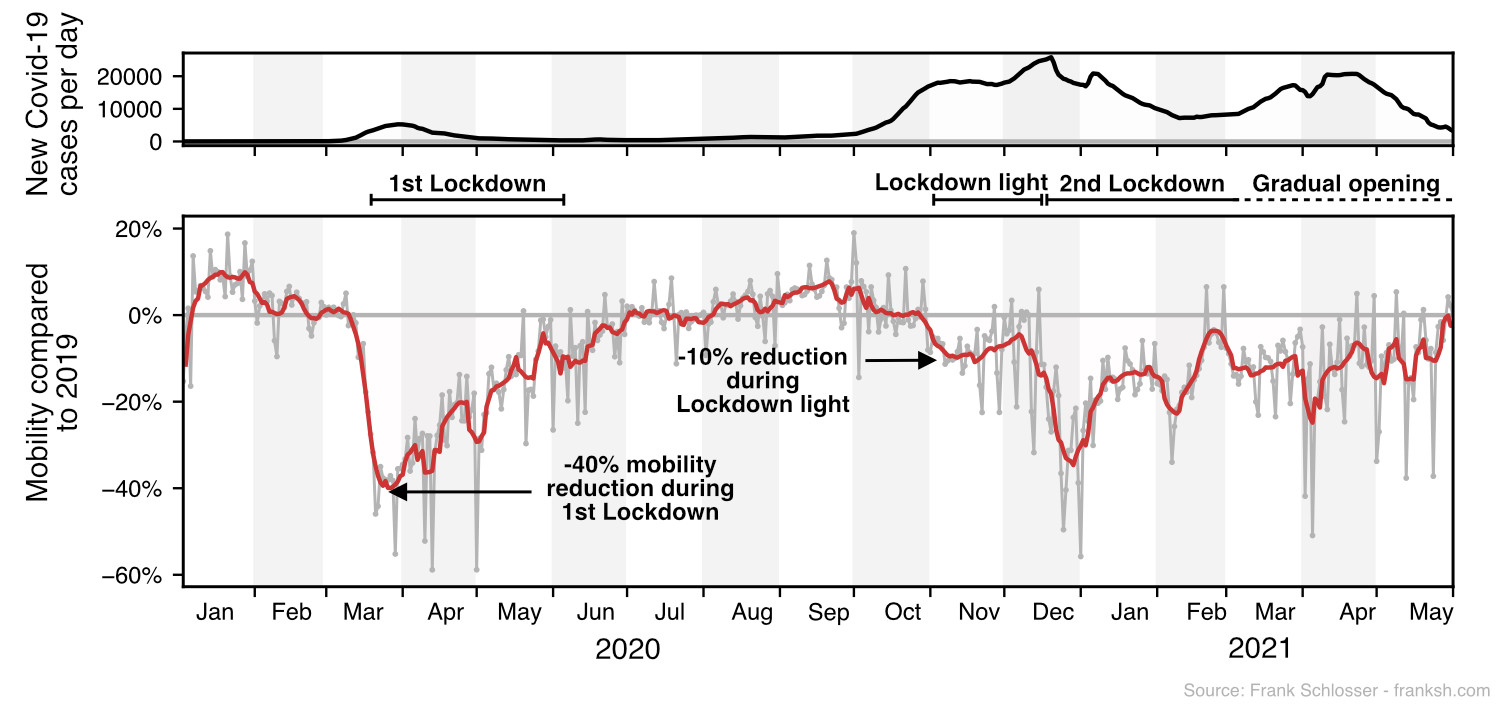
Mobility and case numbers over the course of the Covid-19 pandemic.
Mobility monitor
Early on it was our goal to publish our insights as soon as possible, and we soon launched a project website and the Mobility Monitor, which gives a real-time picture of mobility in Germany, and which we kept up-to-date since March 2020.
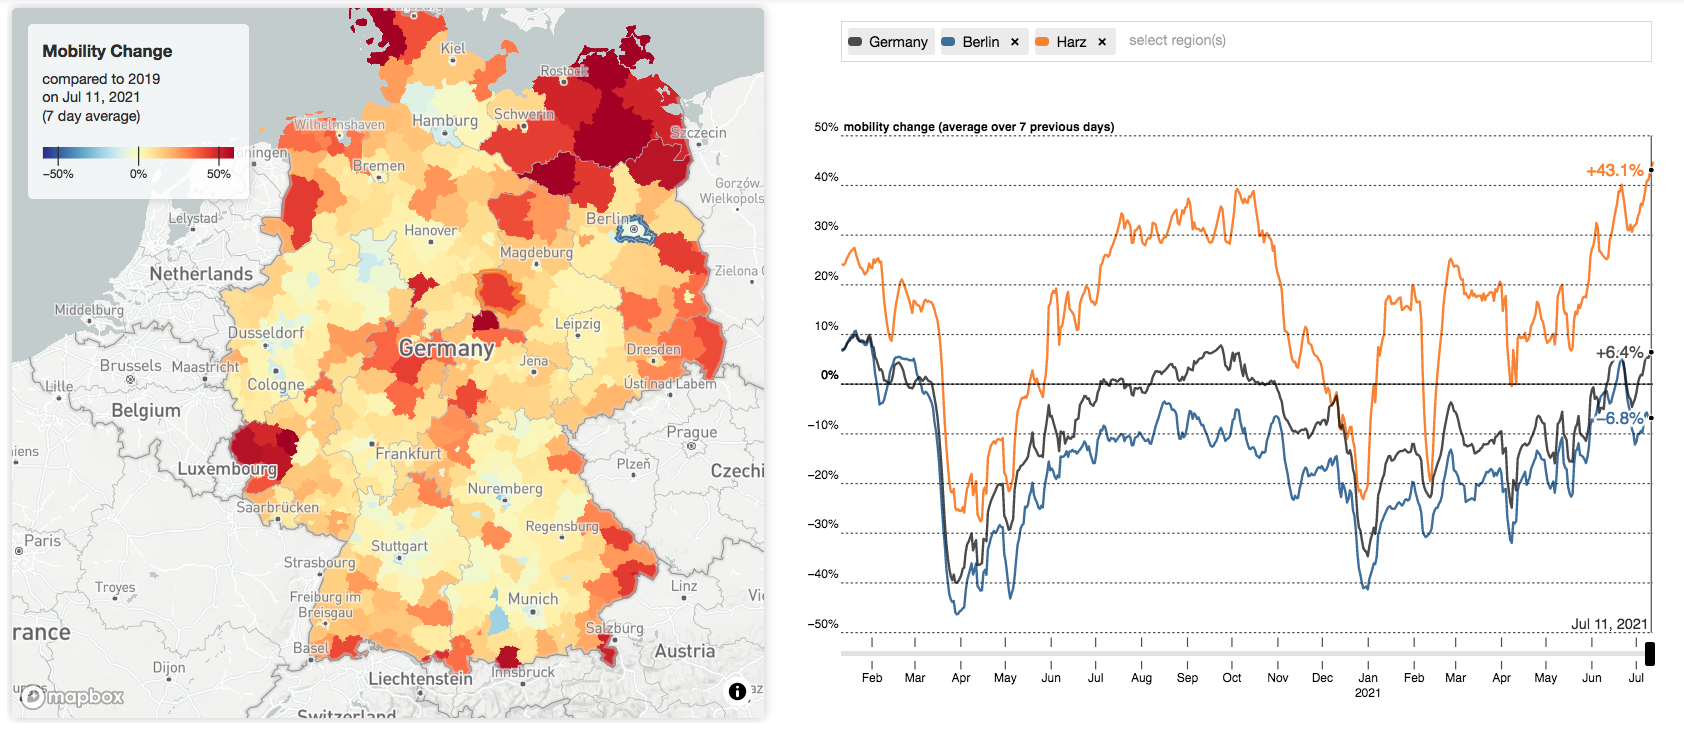
The Mobility Monitor shows whether people are moving more or less than usual.
The Mobility Monitors enabled policy makers and public health officials to stay informed on the situation in near-real time, and to understand the effects of mobility restrictions. It also helped the general public to stay informed about the ongoing crisis.
Research Reports
Over the course of the pandemic, we analyzed a lot of different aspects of mobility. Basically, every 2 weeks another question popped up:
- How was mobility around holidays?
- How much do people move in their free time?
- Are nightly curfews a good idea?
We analyzed these questions and published regular reports on our website. Our reports were used by the RKI, the ministry of health and other institutions in their decision making.
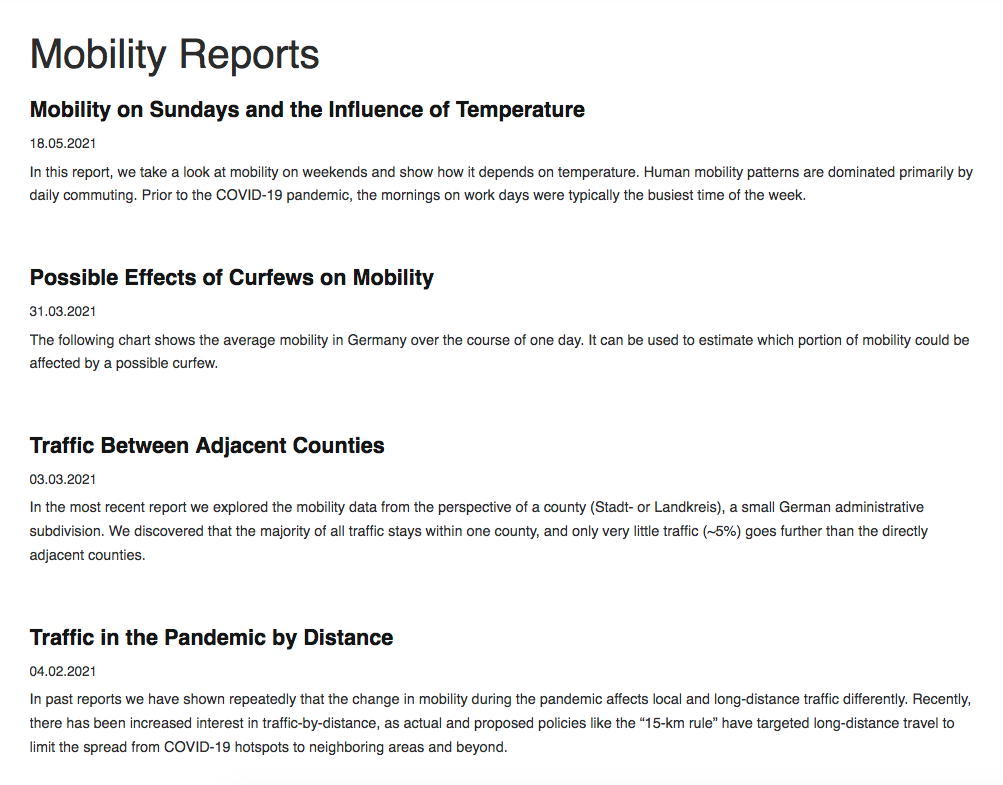
A few of the reports we published.
In the end, we even had time for some deeper research and published a paper:
“COVID-19 lockdown induces disease-mitigating structural changes in mobility networks”
There, we showed that the mobility network underwent deeper structural changes. In particular, the strong reduction in long-distance meant that mobility was more local, which effectively curbed disease spread across long distances.
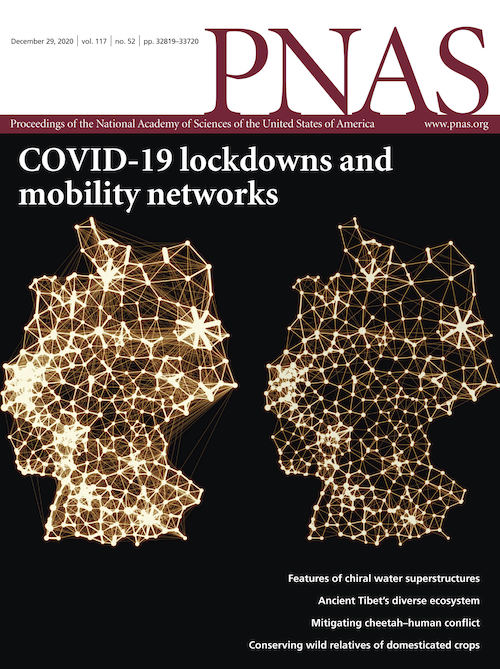
Our paper featured on the cover of PNAS.
I was also interviewed by a few news outlets of the years, and, a personal highlight of mine: Our networks on the cover of the FAZ.
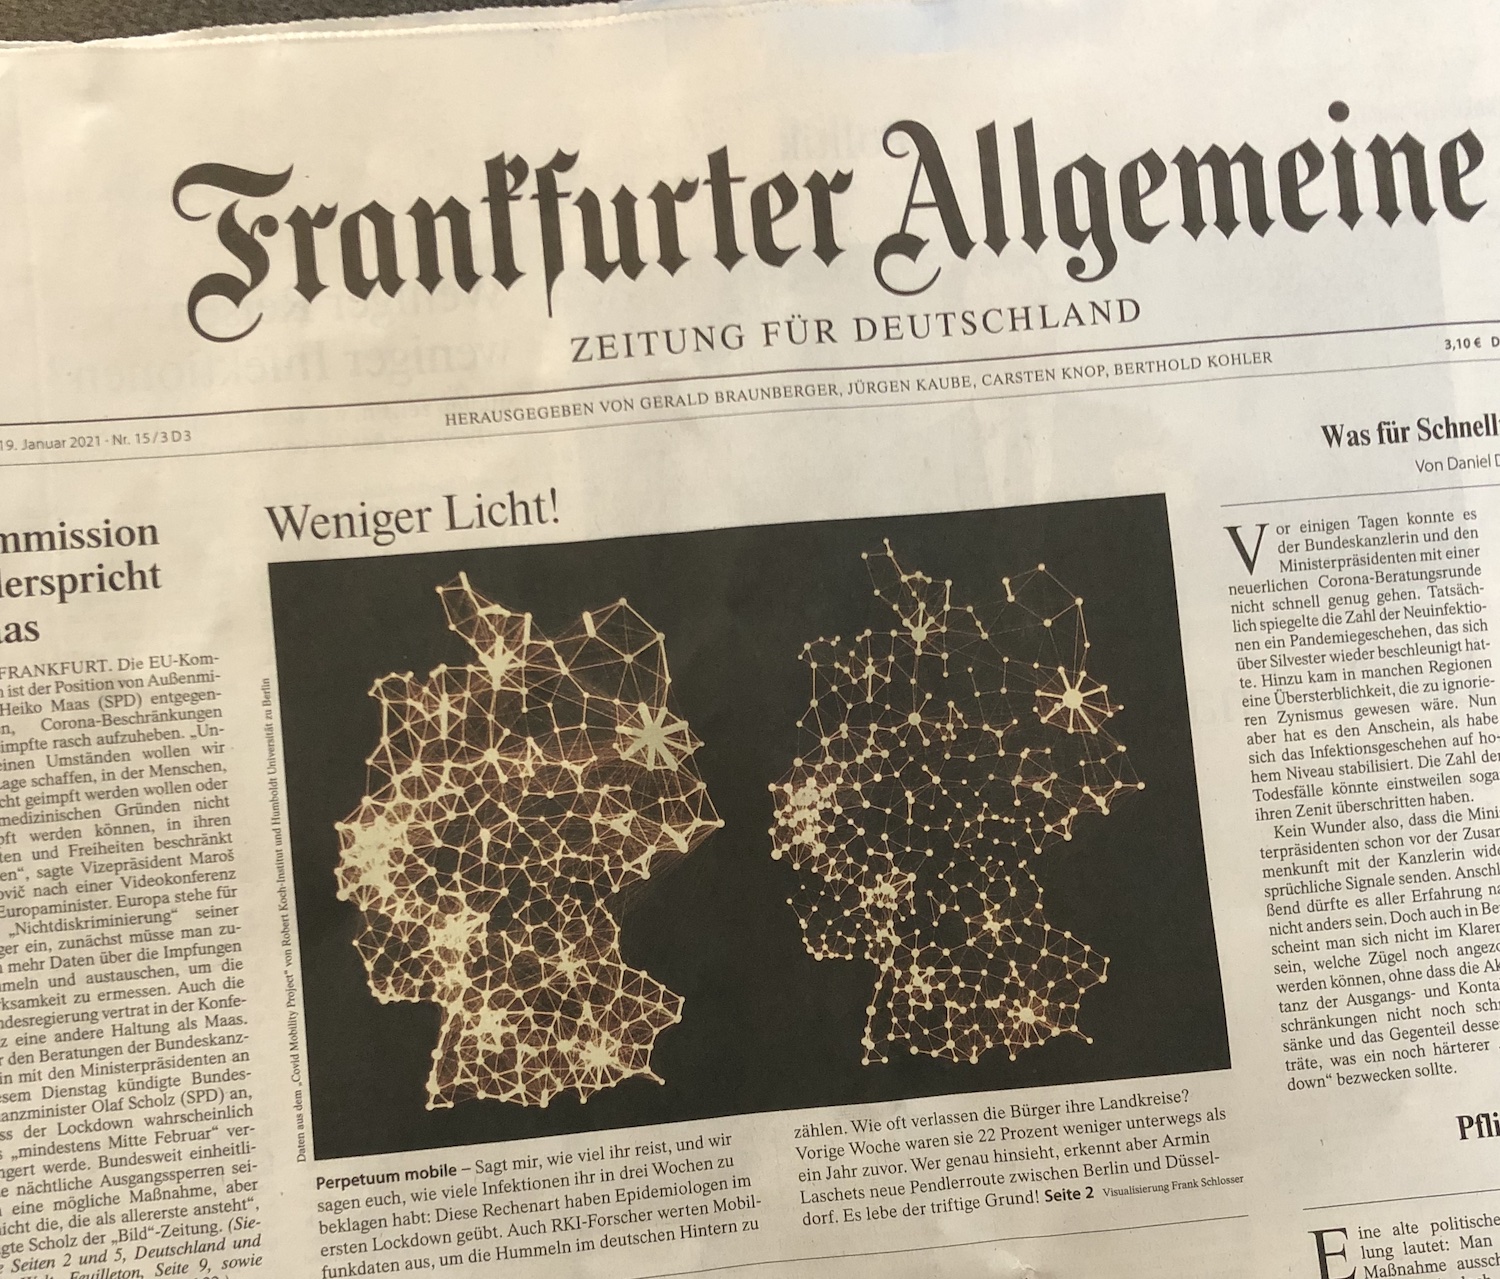
Our research featured in the FAZ, showing the pre-pandemic mobility network (left) and during the pandemic (right).
Conclusion
Overall, the Covid-19 Mobility project really showed how much modern digital data sources can tell us about the world.
The Moblity Monitor and the reports we published became a crucial tool for policy makers at the RKI and the government to understand the effect of mobility restrictions.
I hope that in the future, digital data sources will be used more and more by policy makers to help make informed decisions, like we were able to do with the Covid-19 Mobility Project.